Table of Contents
ToggleAim
Study the transient response of a series RL circuit and understand the time constant concept.
Apparatus
Breadboard, Resistor, Inductor, CRO, Function generator, CRO probes and Connecting wires.
Theory
In this experiment, you will apply a square waveform to the circuit to analyse the transient response of the circuit. The pulse width relative to the circuit’s time constant determines how it is affected by the RL circuit.
Time Constant (τ): It is a measure of time required for certain changes in voltages and currents in and circuits.
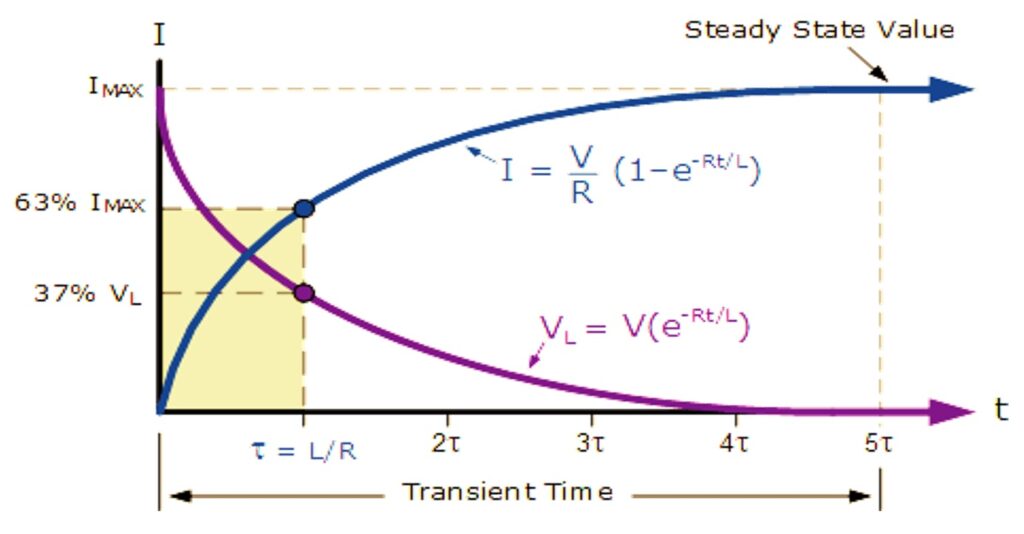
Generally, when the elapsed time exceeds five time constants (5τ) after switching has occurred, the currents and voltages have reached their final value, which is also called steady-state response.
The time constant of an RL circuit is the equivalent inductance divided by the Thevenin’s resistance as viewed from the terminals of the equivalent inductor.
τ=L/R
A pulse is a voltage or current that changes from one level to another and back again. If a waveform’s high time equals its low time, it is called a square wave.
The length of each cycle of a pulse train is its period (T). The pulse width (tp ) of an ideal square wave is equal to half the time period.
The relation between pulse width and frequency for the square wave is given by
In an RL circuit, voltage across the inductor decreases with time while in the RC circuit the voltage across the capacitor increased with time.
Thus, current in an RL circuit has the same form as voltage in an RC circuit: they both rise to their final value exponentially.
The expression for the current in the inductor is given by
for
where V is the applied source voltage to the circuit for RL. The response curve of increasing current is shown in Figure 1.

The expression for the current decay in the inductor is given by
where,
I0 is the initial current stored in the inductor at t=0, and τ=L/R is a time constant.
It can be seen that the voltage across the inductor decreases with time and current does on increasing. Thus, inductor opposes the change in current by storing the magnetic field across it.
Circuit Diagram
Procedure
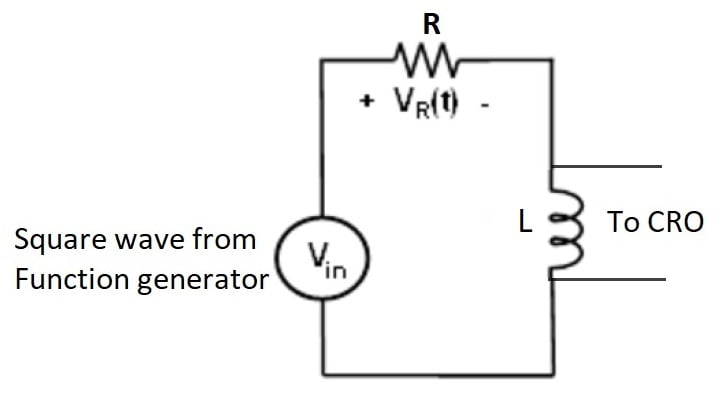
- On Channel 1 of the CRO you will visualize the input voltage, and on channel 2 the voltage on the resistor (It has the same shape as the current through the inductor).
- Generate a square wave on channel 1 of the signal generator with amplitude 4V peak-to-peak. The frequency will be set according to τ.
- Calculate the applied frequency using equation (2) for tp=5τ.
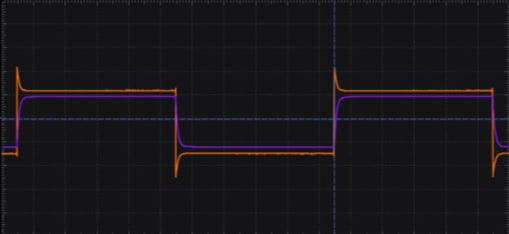
- Apply input for different frequencies and draw input output waveform for various values of frequencies such as tp=15τ, tp=5τ and tp=2τ.

Precautions
- Before circuit connection working condition of all the components must be checked.
- All the connection should be tight.
- CRO probes must be checked before use.
Observations

Conclusion
We have observed output waveforms for different frequencies and it is observed that output voltage increases with increase in frequency or current decreases with increase in frequency.
Recent posts
Related posts:
- Verification of Nortons Theorem
- Verification of Kirchhoffs Laws
- Verification of Superposition Theorem
- Verification of Thevenins theorem
- Verification of Maximum Power Transfer Theorem
- Verify Z-Parameters of Two-port Network
- Verify Y-Parameters of Two-port Network
- Verify Hybrid Parameters of Two-port Network
- Study the transient response of a series RC circuit


To the electronicsforyou.in owner, Your posts are always interesting.
Hello electronicsforyou.in administrator, Thanks for the well-researched post!